File:Mouse left-right axis 02.jpg

Original file (1,313 × 374 pixels, file size: 72 KB, MIME type: image/jpeg)
Mouse Left-Right Axis
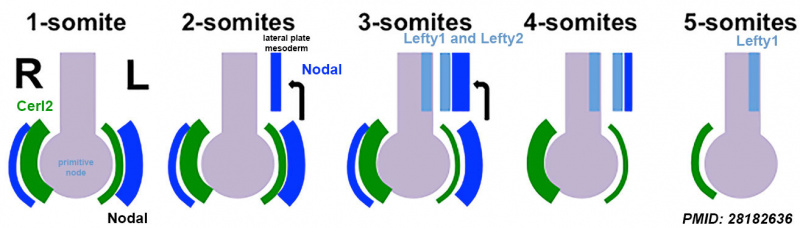
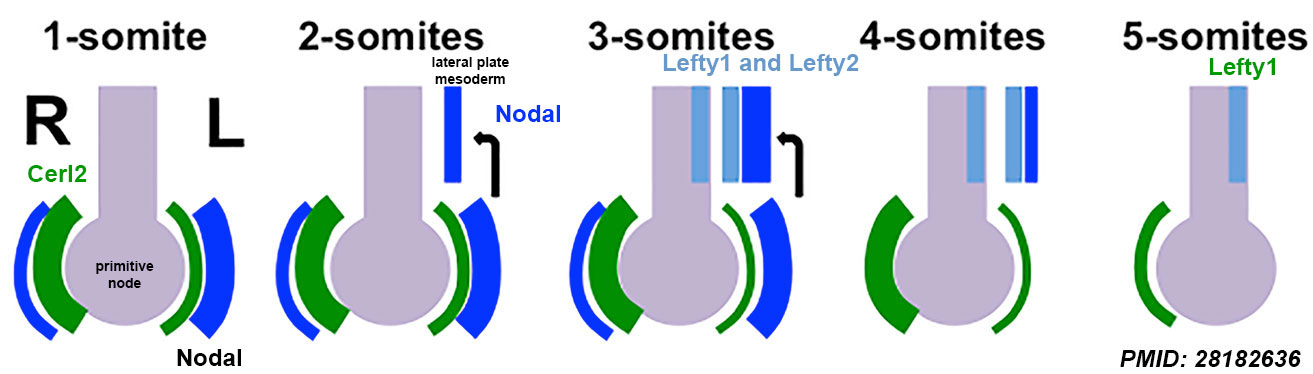
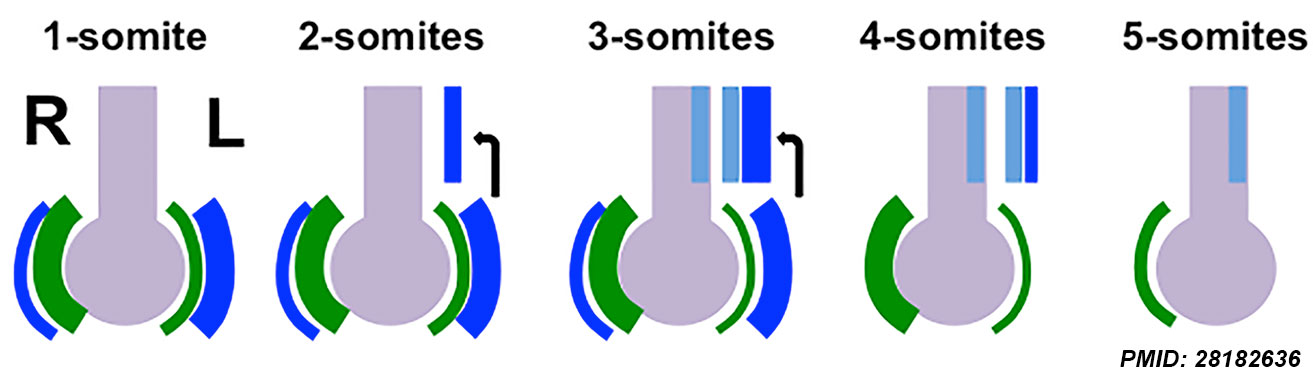
Gastrula stage - Initially perinodal crown cells symmetrically express Nodal, Wnt and their antagonist Cerberus like-2 (Cerl2).
- 1-somite stage Cerl2 expression (green) becomes asymmetric with reduced expression on the left side of the node in response to fluid flow. With reduced expression of its antagonist on the left, Nodal activity and expression (dark blue) increases on the left side and decreases on the right.
- 2-somite stage wild type embryos, Nodal induce Nodal expression in the L-LPM (left lateral plate mesoderm)
- 3-somite stage robust expression of Nodal along with Lefty1 and Lefty2 (light blue) is detected in the L-LPM and Lefty1 in the midline (light blue).
- 4-somite stage embryos Nodal expression is reduced but Lefty1 and Lefty2 are strongly expressed in the L-LPM. Lefty1 expression in the midline and Cerl2 around the node inhibits Nodal signaling in the R-LPM.
- Links: left-right axis mutants | Nodal | Axes Formation | Gastrulation | Mouse E8.0 | Mouse Development
Mouse E8.0 - (Theiler Stage 12a First Somites unturned embryo with first appearance of somite pairs 1-4 somites. The allantois extends further into the exocoelom and the maxillary components of the 1st branchial arch become prominent. The preotic sulcus is visible in the 2-3 somite embryo. The cardiogenic plate begins to form and the foregut pocket is clearly visible. Embryonic age = 8 dpc (range 7.5-8.75 dpc) 1-7 somite pairs
- Mouse Stages: E1 | E2.5 | E3.0 | E3.5 | E4.5 | E5.0 | E5.5 | E6.0 | E7.0 | E7.5 | E8.0 | E8.5 | E9.0 | E9.5 | E10 | E10.5 | E11 | E11.5 | E12 | E12.5 | E13 | E13.5 | E14 | E14.5 | E15 | E15.5 | E16 | E16.5 | E17 | E17.5 | E18 | E18.5 | E19 | E20 | Timeline | About timed pregnancy
| Carnegie | Stage | |||||||||||||||||||||||
| Human | Days | 1 | 2-3 | 4-5 | 5-6 | 7-12 | 13-15 | 15-17 | 17-19 | 20 | 22 | 24 | 28 | 30 | 33 | 36 | 40 | 42 | 44 | 48 | 52 | 54 | 55 | 58 |
| Mouse | Days | 1 | 2 | 3 | E4.5 | E5.0 | E6.0 | E7.0 | E8.0 | E9.0 | E9.5 | E10 | E10.5 | E11 | E11.5 | E12 | E12.5 | E13 | E13.5 | E14 | E14.5 | E15 | E15.5 | E16 |
| Rat | Days | 1 | 3.5 | 4-5 | 5 | 6 | 7.5 | 8.5 | 9 | 10.5 | 11 | 11.5 | 12 | 12.5 | 13 | 13.5 | 14 | 14.5 | 15 | 15.5 | 16 | 16.5 | 17 | 17.5 |
| Note these Carnegie stages are only approximate day timings for average of embryos. Links: Carnegie Stage Comparison | ||||||||||||||||||||||||
| ||||||||||||||||||||||||
| Timeline Links: human timeline | mouse timeline | mouse detailed timeline | chicken timeline | rat timeline | Medaka | Category:Timeline |
Reference
<pubmed>28182636</pubmed>
Copyright
© 2017 Sugrue, Zohn. This is an open access article distributed under the terms of the Creative Commons Attribution License, which permits unrestricted use, distribution, and reproduction in any medium, provided the original author and source are credited.
Fig 6. https://doi.org/10.1371/journal.pone.0171180.g006 Wildtype panel cropped from full figure.
Cite this page: Hill, M.A. (2024, May 4) Embryology Mouse left-right axis 02.jpg. Retrieved from https://embryology.med.unsw.edu.au/embryology/index.php/File:Mouse_left-right_axis_02.jpg
- © Dr Mark Hill 2024, UNSW Embryology ISBN: 978 0 7334 2609 4 - UNSW CRICOS Provider Code No. 00098G
File history
Click on a date/time to view the file as it appeared at that time.
| Date/Time | Thumbnail | Dimensions | User | Comment | |
|---|---|---|---|---|---|
| current | 17:08, 30 April 2017 | 1,313 × 374 (72 KB) | Z8600021 (talk | contribs) | ||
| 12:50, 30 April 2017 | 1,313 × 374 (72 KB) | Z8600021 (talk | contribs) | |||
| 12:22, 30 April 2017 | 1,313 × 374 (63 KB) | Z8600021 (talk | contribs) | |||
| 12:21, 30 April 2017 | 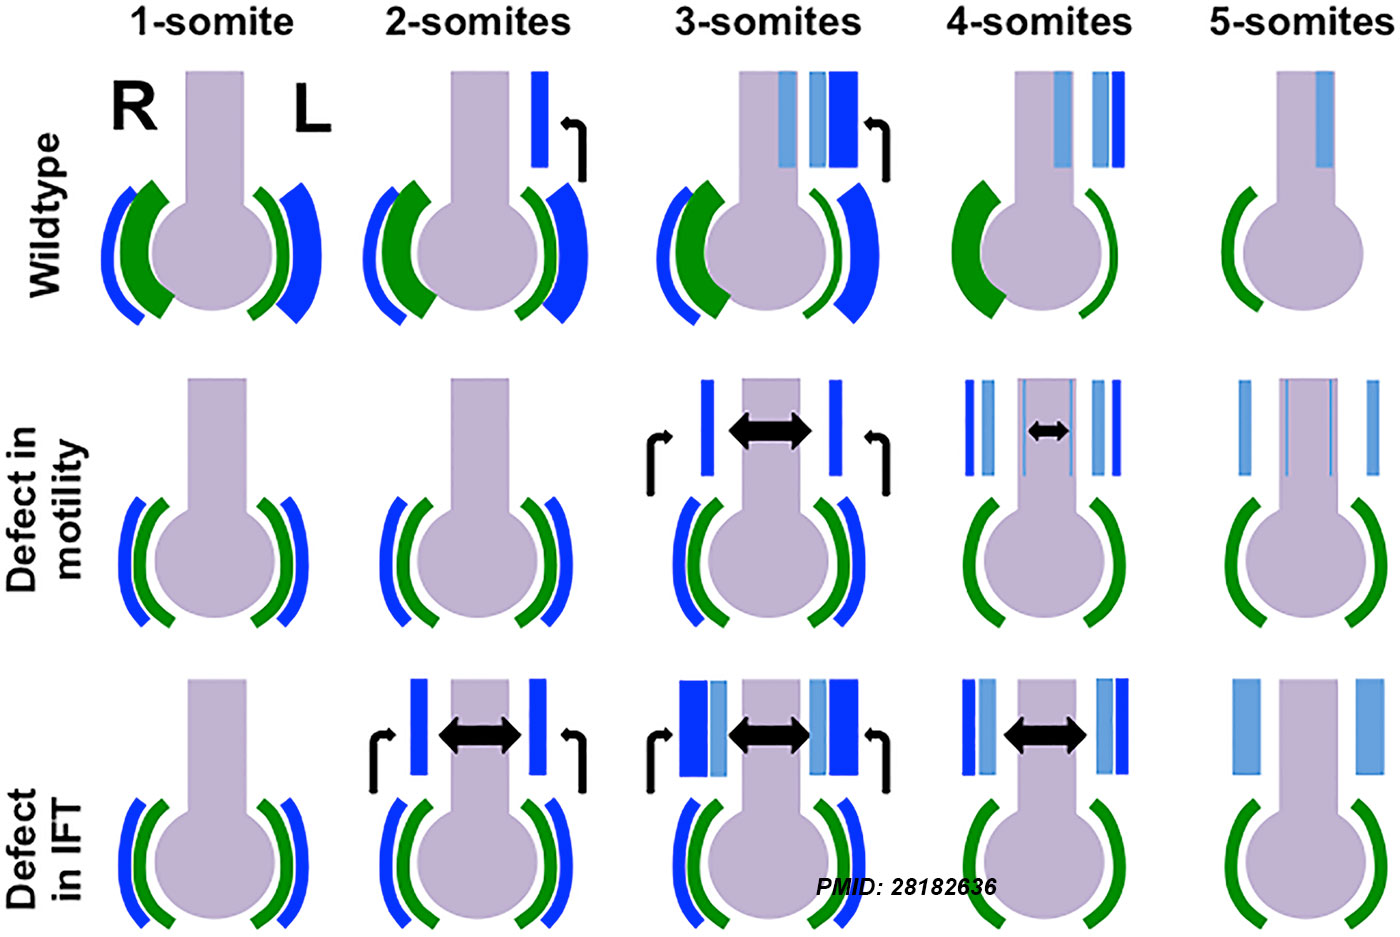 | 1,400 × 937 (172 KB) | Z8600021 (talk | contribs) |
You cannot overwrite this file.
File usage
The following page uses this file: