File:Bovine estrous cycle hormone graph.jpg
From Embryology
Size of this preview: 800 × 546 pixels. Other resolution: 1,000 × 683 pixels.
Original file (1,000 × 683 pixels, file size: 76 KB, MIME type: image/jpeg)
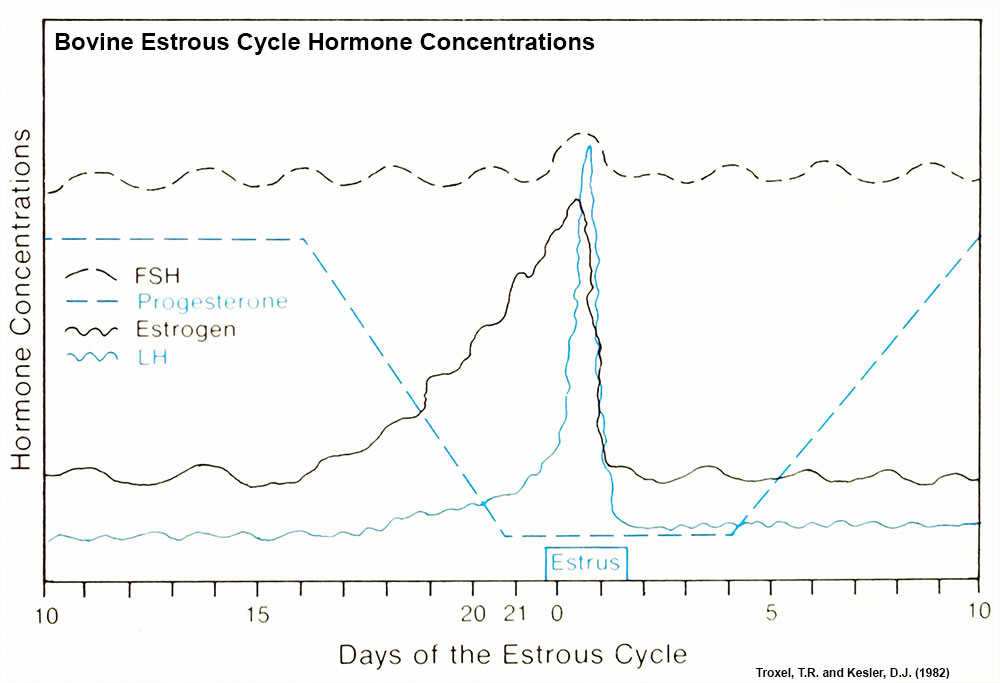
Bovine Estrous Cycle Hormone Levels Graph
Note that specific hormone concentrations are not shown, only the relative hormone levels at different times during the cycle.
Source: Troxel, T.R. and Kesler, D.J. The bovine estrous cycle : dynamics and control (1982) University of Illinois at Urbana-Champaign.
File history
Click on a date/time to view the file as it appeared at that time.
| Date/Time | Thumbnail | Dimensions | User | Comment | |
|---|---|---|---|---|---|
| current | 18:29, 4 November 2013 | | 1,000 × 683 (76 KB) | Z8600021 (talk | contribs) | ==Bovine Estrous Cycle Hormone Levels Graph== Note that specific hormone concentrations are not shown, only the relative hormone levels at different times during the cycle. :Links: Bovine Development | Estrous Cycle Source: Troxel, T.R. a... |
You cannot overwrite this file.
File usage
The following 2 pages use this file: