File:Placenta gene expression.jpg

Original file (925 × 694 pixels, file size: 346 KB, MIME type: image/jpeg)
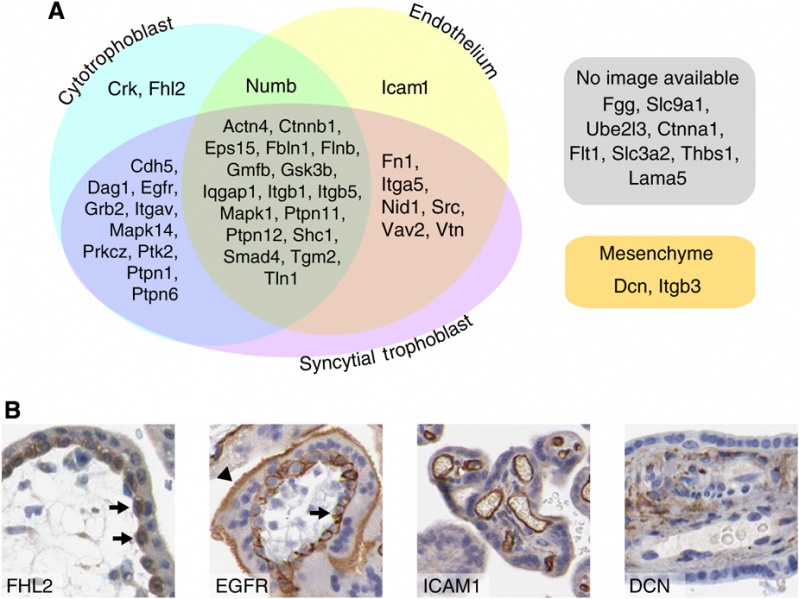
Cell-type specificity of the labyrinth phenotype protein–protein interaction network.
Classification of cell-type expression of protein network members by immunohistochemistry data from Protein Atlas.
(A) A Venn diagram of unique and overlapping expression patterns.
(B) Representative images showing expression in the cytotrophoblast (arrows; FHL2), cytotrophoblast (arrows) and syncytial trophoblast (triangle; EGFR), endothelium (ICAM1) and mesenchyme (DCN).
Original file name: Figure 5 Msb200937-f5.jpg http://www.nature.com/msb/journal/v5/n1/fig_tab/msb200937_F5.html
Reference
<pubmed>19536202</pubmed>
Molecular Systems Biology 5 Article number: 279 doi:10.1038/msb.2009.37
Published online: 16 June 2009
Citation: Molecular Systems Biology 5:279
This is an open-access article distributed under the terms of the Creative Commons Attribution Licence, which permits distribution and reproduction in any medium, provided the original author and source are credited. This licence does not permit commercial exploitation or the creation of derivative works without specific permission.
File history
Click on a date/time to view the file as it appeared at that time.
| Date/Time | Thumbnail | Dimensions | User | Comment | |
|---|---|---|---|---|---|
| current | 07:11, 24 August 2010 | | 925 × 694 (346 KB) | S8600021 (talk | contribs) | Cell-type specificity of the labyrinth phenotype protein–protein interaction network. Classification of cell-type expression of protein network members by immunohistochemistry data from Protein Atlas. (A) A Venn diagram of unique and overlapping exp |
You cannot overwrite this file.
File usage
The following 3 pages use this file: