File:Menstrual cycle- estradiol and progesterone graph.jpg
Menstrual_cycle-_estradiol_and_progesterone_graph.jpg (558 × 593 pixels, file size: 95 KB, MIME type: image/jpeg)
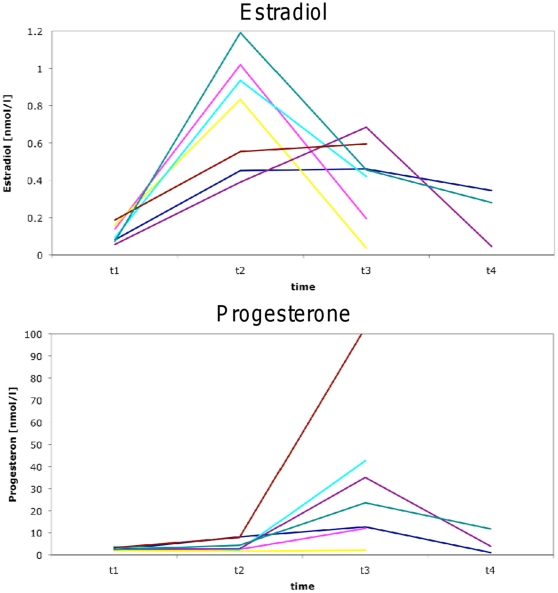
Quantitative hormone changes during the menstrual cycle
For estradiol and progesterone of all 8 female subjects.
For clarification, time points are connected by straight lines. Note: only half of the subjects were measured at t4; part of the lines overlie. All but one subjects showed hormone levels within physiological levels and indicating ovulatory cycles: This is an increase of estradiol levels at t2 and/or elevated progesterone levels after t2. One subject showed no increase in progesterone at t3, indicating missing ovulation, and was excluded from further studies, along with the matched male.
Each scanning session was scheduled early in the morning at the same time (7:30 am), with minimal food and fluid intake. Each male was paired with a female and scanned in one recording session at three or four time points during the respective menstrual cycle.
Scanning took place:
(t1) - during menses
(t2) - at time of ovulation
(t3) - midluteal phase
(t4) - beginning of the next menses (half of the subjects were scanned again)
Only women known to have an ovulational cyclus were allowed for the scanning protocol. This was achieved by an intravaginal ultrasound performed by an experienced gynecologist. To ascertain an ovulational cyclus and the time point of ovulation (t2) during the month the actual MR-scanning took place, ultrasound was repeated and scanning at t2 took place the day after a follicle ready for ovulation was detected.
- Links: menstrual cycle
Reference
Hagemann G, Ugur T, Schleussner E, Mentzel HJ, Fitzek C, Witte OW & Gaser C. (2011). Changes in brain size during the menstrual cycle. PLoS ONE , 6, e14655. PMID: 21326603 DOI.
Copyright
Hagemann et al. This is an open-access article distributed under the terms of the Creative Commons Attribution License, which permits unrestricted use, distribution, and reproduction in any medium, provided the original author and source are credited.
Original file name: Figure 1 Pone.0014655.g001.jpg
Cite this page: Hill, M.A. (2024, April 28) Embryology Menstrual cycle- estradiol and progesterone graph.jpg. Retrieved from https://embryology.med.unsw.edu.au/embryology/index.php/File:Menstrual_cycle-_estradiol_and_progesterone_graph.jpg
- © Dr Mark Hill 2024, UNSW Embryology ISBN: 978 0 7334 2609 4 - UNSW CRICOS Provider Code No. 00098G
File history
Click on a date/time to view the file as it appeared at that time.
| Date/Time | Thumbnail | Dimensions | User | Comment | |
|---|---|---|---|---|---|
| current | 07:39, 17 February 2011 | | 558 × 593 (95 KB) | S8600021 (talk | contribs) | ==Quantitative hormone changes during the menstrual cycle== For estradiol and progesterone of all 8 female subjects. For clarification, time points are connected by straight lines. Note: only half of the subjects were measured at t4; part of the lines o |
You cannot overwrite this file.
File usage
There are no pages that use this file.