File:Fetal liver weight growth graph.jpg
From Embryology
No higher resolution available.
Fetal_liver_weight_growth_graph.jpg (800 × 521 pixels, file size: 34 KB, MIME type: image/jpeg)
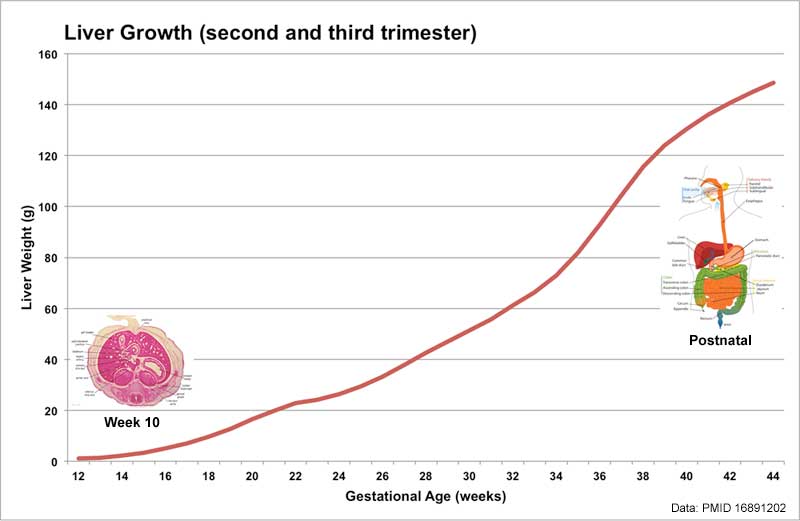
Human Fetal Liver Weight Growth
Graph based on data from FitzSimmons J, Chinn A, Shepard TH. (1988)[1][2]
Note original data based upon gestational age (GA or LMP). Post-fertilization age would be approximately 2 weeks earlier. For educational purposes only.
- Fetal Graphs: Crown-Rump Length (CRL) | Third trimester CRL | Head Circumference | Head Circumference 2nd Trimester | Liver Weight | Pancreas Weight | Thymus Weight | Small Intestine Length | Large Intestine Length | Length and Weight Changes | Fetal Development | Liver Development
References
Data
| Gestational Age | Fertilisation Age | Weight (g) |
| 12 | 10 | 1.0 |
| 13 | 11 | 1.4 |
| 14 | 12 | 2.2 |
| 15 | 13 | 3.4 |
| 16 | 14 | 5.1 |
| 17 | 15 | 7.1 |
| 18 | 16 | 9.6 |
| 19 | 17 | 12.8 |
| 20 | 18 | 16.5 |
| 21 | 19 | 19.9 |
| 22 | 20 | 22.7 |
| 23 | 21 | 24.3 |
| 24 | 22 | 26.4 |
| 25 | 23 | 29.4 |
| 26 | 24 | 33.2 |
| 27 | 25 | 37.8 |
| 28 | 26 | 42.6 |
| 29 | 27 | 46.9 |
| 30 | 28 | 51.3 |
| 31 | 29 | 55.9 |
| 32 | 30 | 61.2 |
| 33 | 31 | 66.3 |
| 34 | 32 | 72.8 |
| 35 | 33 | 81.8 |
| 36 | 34 | 92.8 |
| 37 | 35 | 104.4 |
| 38 | 36 | 115.6 |
| 39 | 37 | 124.0 |
| 40 | 38 | 130.4 |
| 41 | 39 | 136.0 |
| 42 | 40 | 140.8 |
| 43 | 41 | 144.9 |
| 44 | 42 | 148.6 |
File history
Click on a date/time to view the file as it appeared at that time.
| Date/Time | Thumbnail | Dimensions | User | Comment | |
|---|---|---|---|---|---|
| current | 15:15, 3 April 2012 | | 800 × 521 (34 KB) | Z8600021 (talk | contribs) | ==Human Fetal Liver Weight Growth== Graph based on data from FitzSimmons J, Chinn A, Shepard TH. (1988)<ref><pubmed>3244599</pubmed></ref><ref><pubmed>16891202</pubmed></ref> Note original data based upon gestational age (GA or LMP). Post-fertilization |
You cannot overwrite this file.
File usage
The following 4 pages use this file: