File:FISH for DiGeorge Syndrome.jpg
FISH_for_DiGeorge_Syndrome.jpg (600 × 470 pixels, file size: 31 KB, MIME type: image/jpeg)
Image Information
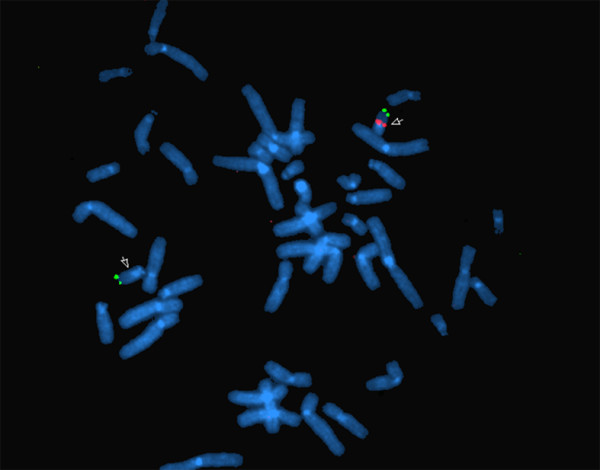
Figure 2
FISH analysis of the proband using a probe (labeled red) specific for DiGeorge Syndrome critical region (TUPLE). A single red signal (white arrow) can be seen on the normal chromosome 22, while the red signal is absent on the chromosome 22 with the deletion. Two green signals are seen on the subtelomeres of both homologues (control probe).
Reference
Manolakos. E. Sarri. C, Vetro. A, Kefalas. K, Leze. E, Sofocleus. C, Kitsos. G, Merou. K, Kokotas. H, Papadopoulou. A, Attilakos. A, Petersen. M, Kitsiou-Tzeli. S (2011) Combined 22q11.1-q11.21 deletion with 15q11.2-q13.3 duplication identified by array-CGH in a 6 years old. Molecular Cytogenetics. 4: 6
Link: http://www.ncbi.nlm.nih.gov/pmc/articles/PMC3058102/figure/F2/
Copyright
©2011 Manolakos et al; licensee BioMed Central Ltd. This is an Open Access article distributed under the terms of the Creative Commons Attribution License (http://creativecommons.org/licenses/by/2.0), which permits unrestricted use, distribution, and reproduction in any medium, provided the original work is properly cited.
- Note - This image was originally uploaded as part of an undergraduate science student project and may contain inaccuracies in either description or acknowledgements. Students have been advised in writing concerning the reuse of content and may accidentally have misunderstood the original terms of use. If image reuse on this non-commercial educational site infringes your existing copyright, please contact the site editor for immediate removal.
Cite this page: Hill, M.A. (2024, May 13) Embryology FISH for DiGeorge Syndrome.jpg. Retrieved from https://embryology.med.unsw.edu.au/embryology/index.php/File:FISH_for_DiGeorge_Syndrome.jpg
- © Dr Mark Hill 2024, UNSW Embryology ISBN: 978 0 7334 2609 4 - UNSW CRICOS Provider Code No. 00098G
File history
Click on a date/time to view the file as it appeared at that time.
| Date/Time | Thumbnail | Dimensions | User | Comment | |
|---|---|---|---|---|---|
| current | 00:05, 17 August 2011 | | 600 × 470 (31 KB) | Z3288827 (talk | contribs) | Figure 2 FISH analysis of the proband using a probe (labeled red) specific for DiGeorge Syndrome critical region (TUPLE). A single red signal (white arrow) can be seen on the normal chromosome 22, while the red signal is absent on the chromosome 22 with t |
You cannot overwrite this file.
File usage
The following 3 pages use this file: