File:Melanoma chromosome graph.jpg
Original file (800 × 727 pixels, file size: 76 KB, MIME type: image/jpeg)
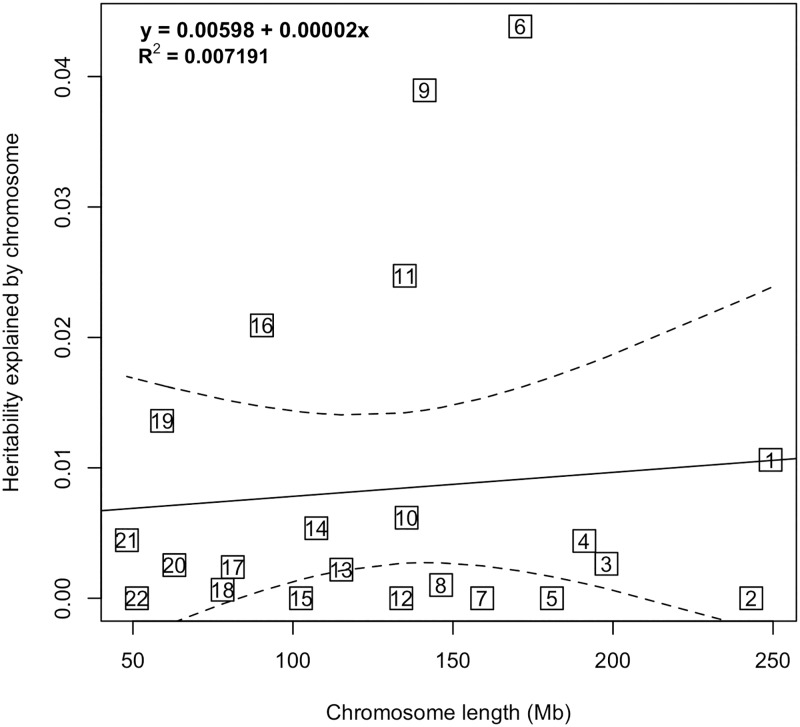
Melanoma heritability stratified by chromosome
Heritability estimates for each chromosome are plotted against chromosome length. The solid line is the regression of heritability on chromosome length and the dashed lines represent the 95% confidence intervals for the slope of the regression line. Chromosomes 6, 9, 11 and 16 are outside the 95% confidence interval and have higher heritability estimates than that expected based on chromosome length.
Melanoma susceptibility is associated with chromosomes 6, 9, 11, and 16.
- Links: Integumentary System - Abnormalities | Chromosome 6 | Chromosome 9 | Chromosome 11
Reference
Hulur I, Skol AD, Gamazon ER, Cox NJ & Onel K. (2017). Integrative genetic analysis suggests that skin color modifies the genetic architecture of melanoma. PLoS ONE , 12, e0185730. PMID: 28973033 DOI.
Copyright
© 2017 Hulur et al. This is an open access article distributed under the terms of the Creative Commons Attribution License, which permits unrestricted use, distribution, and reproduction in any medium, provided the original author and source are credited.
Fig 1. Pone.0185730.g001.jpg
File history
Click on a date/time to view the file as it appeared at that time.
| Date/Time | Thumbnail | Dimensions | User | Comment | |
|---|---|---|---|---|---|
| current | 06:28, 14 April 2018 | | 800 × 727 (76 KB) | Z8600021 (talk | contribs) | ==Melanoma heritability stratified by chromosome== Heritability estimates for each chromosome are plotted against chromosome length. The solid line is the regression of heritability on chromosome length and the dashed lines represent the 95% confidenc... |
You cannot overwrite this file.
File usage
The following page uses this file: