File:USA percentage low birthweight by maternal age.jpg
USA_percentage_low_birthweight_by_maternal_age.jpg (498 × 478 pixels, file size: 46 KB, MIME type: image/jpeg)
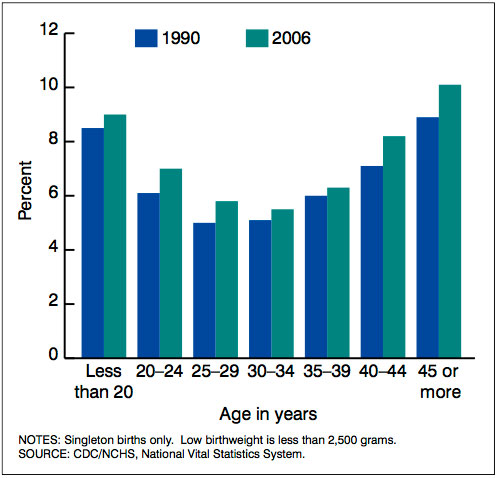
Percentage low birthweight by age of mother: United States: 1990 and 2006
Links NVSR USA Births 2006: Cesarean rate by gestational age | Live births and fertility rates | Mean age mother first birth by state | Change distribution births by gestational age | Percentage low birthweight by maternal age | Triplet birth rate | Reference | Birth | National Vital Statistics Reports
Over the past several decades, national LBW levels have been strongly influenced by the large growth in the rate of multiple births, more than one-half of which are delivered at less than 2,500 grams (see section on multiple births). However, when only births in singleton deliveries are examined, a substantial rise in LBW is also observed (Table G). Between 2005 to 2006, the LBW rate for singletons rose from 6.41 to 6.49 percent; this rate is up 10 percent since 1990 (5.90 percent). Over the period 1990 to 2006, important increases in LBW rates are seen among singleton births to women under age 20–44 years, see Figure 9.
The full birthweight distribution has changed markedly in recent years for all births and for singletons only. Between 1990 and 2006, the percentage of singleton births weighing less than 3,500 grams has risen, whereas that for heavier infants has declined (7). The decline at 3,500–4,499 grams (7 lb 12 oz–9 lb 14 oz) is of especial concern because infant mortality is least likely at these weights (93). The reasons behind the shift towards lower birthweights may be similar to those suggested for the national trend towards shorter gestational ages, that is, obstetric intervention earlier in pregnancy, older maternal age at childbearing, and increased use of infertility therapies (89,90,96,97). See also sections on ‘‘Gestational age,’’ ‘‘Obstetric procedures,’’ and ‘‘Method of delivery.’’
NOTE: Singleton births only.
Reference
CDC/NCHS, National Vital Statistics System.
Martin JA, Hamilton BE, Sutton PD, Ventura SJ, et al. Births: Final data for 2006. National vital statistics reports; vol 57 no 7. Hyattsville, MD: National Center for Health Statistics. 2009.
Copyright
All material appearing in this report is in the public domain and may be reproduced or copied without permission; citation as to source, however, is appreciated
Cite this page: Hill, M.A. (2024, April 19) Embryology USA percentage low birthweight by maternal age.jpg. Retrieved from https://embryology.med.unsw.edu.au/embryology/index.php/File:USA_percentage_low_birthweight_by_maternal_age.jpg
- © Dr Mark Hill 2024, UNSW Embryology ISBN: 978 0 7334 2609 4 - UNSW CRICOS Provider Code No. 00098G
File history
Click on a date/time to view the file as it appeared at that time.
| Date/Time | Thumbnail | Dimensions | User | Comment | |
|---|---|---|---|---|---|
| current | 18:01, 9 April 2010 |  | 498 × 478 (46 KB) | S8600021 (talk | contribs) | Percentage low birthweight by age of mother: United States: 1990 and 2006 Over the past several decades, national LBW levels have been strongly influenced by the large growth in the rate of multiple births, more than one-half of which are delivered at le |
You cannot overwrite this file.
File usage
The following page uses this file:
