File:USA change distribution births by gestational age.jpg
USA_change_distribution_births_by_gestational_age.jpg (499 × 457 pixels, file size: 18 KB, MIME type: image/jpeg)
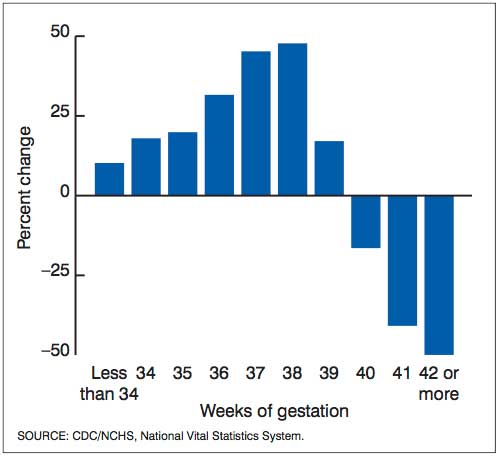
Percent change in the distribution of births by gestational age: United States, 1990 and 2006
Links NVSR USA Births 2006: Cesarean rate by gestational age | Live births and fertility rates | Mean age mother first birth by state | Change distribution births by gestational age | Percentage low birthweight by maternal age | Triplet birth rate | Reference | Birth | National Vital Statistics Reports
Figure presents the marked shift in the gestational age distribution of U.S. births between 1990 and 2006. Over this 16-year period, late preterm (34–36 weeks) and early term (37 and 38 weeks) births have risen sharply, whereas births at 40 weeks or more have markedly declined.
Original File: Figure 8. Percent change in the distribution of births by gestational age: United States, 1990 and 2006 SOURCE: CDC/NCHS, National Vital Statistics System.
NOTE: Singleton births only.
Martin JA, Hamilton BE, Sutton PD, Ventura SJ, et al. Births: Final data for 2006. National vital statistics reports; vol 57 no 7. Hyattsville, MD: National Center for Health Statistics. 2009.
Copyright information - All material appearing in this report is in the public domain and may be reproduced or copied without permission; citation as to source, however, is appreciated
File history
Click on a date/time to view the file as it appeared at that time.
| Date/Time | Thumbnail | Dimensions | User | Comment | |
|---|---|---|---|---|---|
| current | 17:56, 9 April 2010 | | 499 × 457 (18 KB) | S8600021 (talk | contribs) | Percent change in the distribution of births by gestational age: United States, 1990 and 2006 SOURCE: CDC/NCHS, National Vital Statistics System. NOTE: Singleton births only. Martin JA, Hamilton BE, Sutton PD, Ventura SJ, et al. Births: Final data for |
You cannot overwrite this file.
File usage
The following page uses this file: