File:Brain growth and birth size.jpg
Brain_growth_and_birth_size.jpg (800 × 492 pixels, file size: 70 KB, MIME type: image/jpeg)
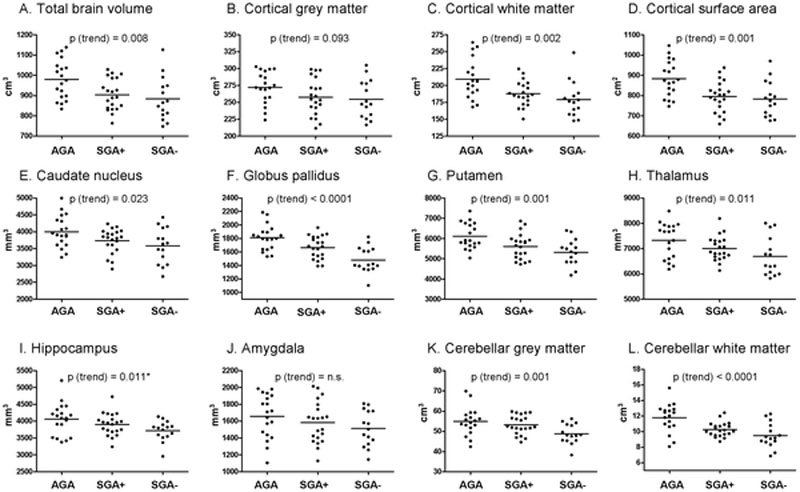
Brain Growth and Birth Size
Global brain parameters in AGA, SGA+ and SGA− children
Only data from the right hemisphere are shown. Bars depict the mean within each group. P-values for trend derived from polynomial contrast analyses are shown (see also Table 2). P-values of the left hemisphere are mentioned only when statistically different compared to p-values of the right hemisphere.
- AGA appropriate for gestational age
- SGA+ small for gestational age with catch-up growth
- SGA− small for gestational age without catch-up growth
- n.s. not signifcant. * P-value of left hemisphere not significant.
Figure 1. Journal.pone.0024116.g001.png doi:10.1371/journal.pone.0024116.g001
Reference
De Bie HM, Oostrom KJ, Boersma M, Veltman DJ, Barkhof F, Delemarre-van de Waal HA & van den Heuvel MP. (2011). Global and regional differences in brain anatomy of young children born small for gestational age. PLoS ONE , 6, e24116. PMID: 21931650 DOI.
Copyright
© 2011 De Bie et al. This is an open-access article distributed under the terms of the Creative Commons Attribution License, which permits unrestricted use, distribution, and reproduction in any medium, provided the original author and source are credited.
Cite this page: Hill, M.A. (2024, April 20) Embryology Brain growth and birth size.jpg. Retrieved from https://embryology.med.unsw.edu.au/embryology/index.php/File:Brain_growth_and_birth_size.jpg
- © Dr Mark Hill 2024, UNSW Embryology ISBN: 978 0 7334 2609 4 - UNSW CRICOS Provider Code No. 00098G
File history
Click on a date/time to view the file as it appeared at that time.
| Date/Time | Thumbnail | Dimensions | User | Comment | |
|---|---|---|---|---|---|
| current | 13:43, 20 September 2011 | | 800 × 492 (70 KB) | S8600021 (talk | contribs) | ==Brain growth and birth size== Global brain parameters in AGA, SGA+ and SGA− children Only data from the right hemisphere are shown. Bars depict the mean within each group. P-values for trend derived from polynomial contrast analyses are shown (see a |
You cannot overwrite this file.
File usage
The following page uses this file: