File:Bovine morula and blastocyst 01.jpg
Original file (989 × 1,200 pixels, file size: 231 KB, MIME type: image/jpeg)
Bovine Morula and Blastocyst
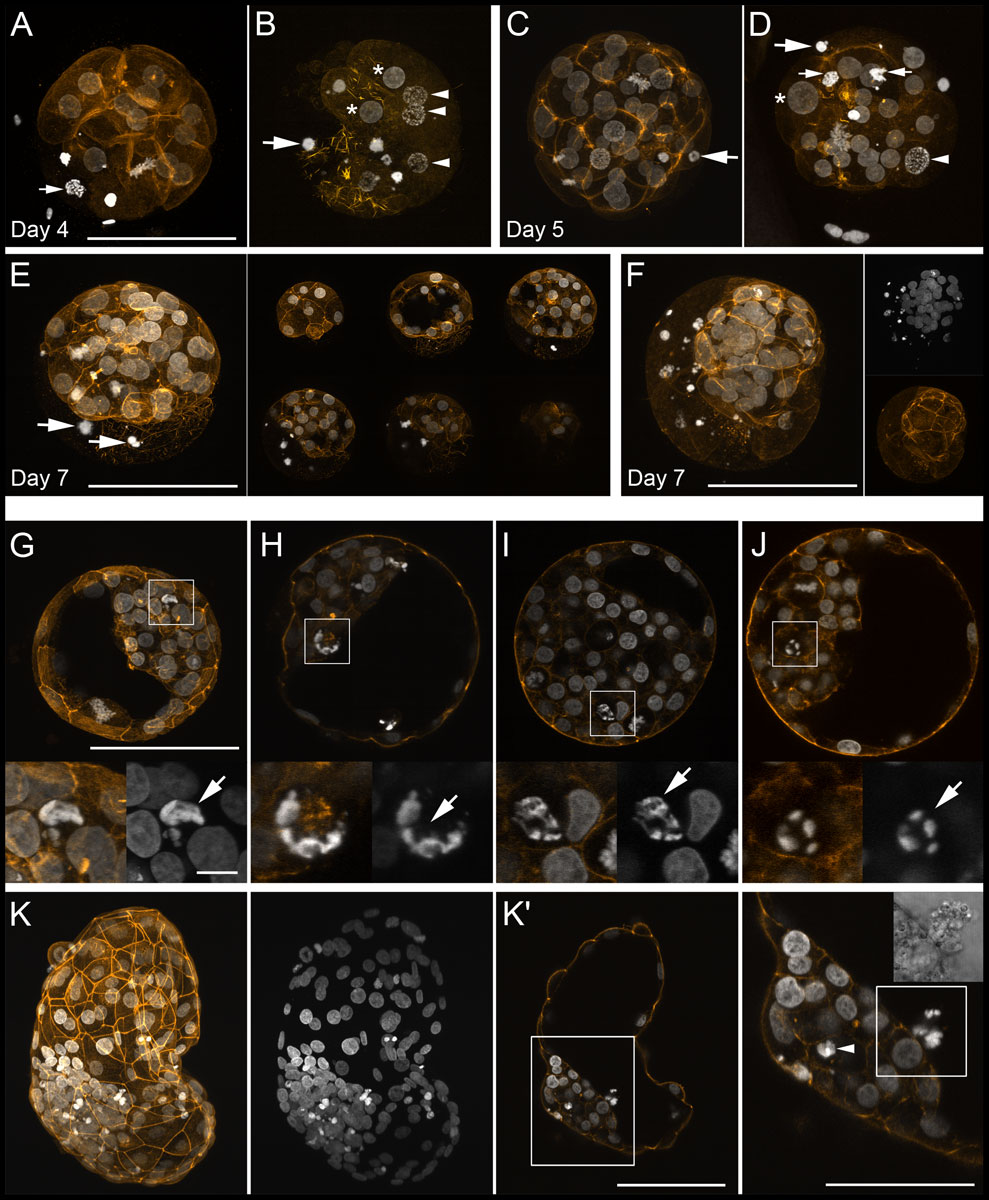
The embryos were fixed and mounted on coverslips in such a way that the three-dimensional structure was maintained. DNA staining with DAPI is shown in white, f-actin filaments (phalloidin-TRITC) in orange. Scale bars represent 100 µm (overviews) or 10 µm (details).
A–F: Arrest and death of early blastomeres during the first four cleavage cycles.
A–D: Maximum intensity z-projections of optical serial sections of embryos examined at day 4 (A, B) or day 5 (C, D). Many embryos show large early blastomeres that are arrested at interphase (asterisks) or prophase (arrow heads) or already show clear signs of cell death: DAPI staining reveals variably sized and irregularly shaped clumps of highly condensed chromatin (large arrows). Notably, frequent findings are remnants of mitotic chromosome structures (small arrows).
E, F: Two day 7 embryos that initially survived the death of large early blastomeres. Remnants of early blastomere death can be seen until blastocyst hatching.
Panel E shows an embryo in the form of a single maximum intensity z-projection of the entire confocal image stack (left) and as a sequence of six projections of 20 µm image sub-stacks (right).
Panel F presents a z-projection (overlay image and separate channel images) through an entire embryo.
G–L: Cell death in the inner cell mass of bovine IVF blastocysts examined at day 7: In expanding and hatching blastocysts, DAPI staining reveals highly condensed chromatin structures that are irregularly shaped and variable in size referring to different modes and stages of cell death (arrows).
G–J: Four expanding blastocysts.
G is a maximum intensity z-projection of a 20 µm image stack, H, I, J are single optical sections. Dying/dead cells are also shown at higher magnification. K, K′: Hatched blastocyst. Panel K presents a maximum intensity z-projection of a stack spanning the entire embryo (overlay image and DAPI alone). K′: Single optical section of the same blastocyst and enlarged view of the inner cell mass: Note a dying/dead cell (arrow head) in the interior of the inner cell mass as well as the extrusion of a dead cell into the blastocoel
- Links: Image - Morula and Blastocyst | Morula A | Blastocyst F | Blastocyst G | Bovine Development | Morula | Blastocyst
Reference
Leidenfrost S, Boelhauve M, Reichenbach M, Güngör T, Reichenbach HD, Sinowatz F, Wolf E & Habermann FA. (2011). Cell arrest and cell death in mammalian preimplantation development: lessons from the bovine model. PLoS ONE , 6, e22121. PMID: 21811561 DOI.
Copyright
© 2011 Leidenfrost et al. This is an open-access article distributed under the terms of the Creative Commons Attribution License, which permits unrestricted use, distribution, and reproduction in any medium, provided the original author and source are credited. Figure 2. CLSM analysis (insert: transmission light image).
Cite this page: Hill, M.A. (2024, April 23) Embryology Bovine morula and blastocyst 01.jpg. Retrieved from https://embryology.med.unsw.edu.au/embryology/index.php/File:Bovine_morula_and_blastocyst_01.jpg
- © Dr Mark Hill 2024, UNSW Embryology ISBN: 978 0 7334 2609 4 - UNSW CRICOS Provider Code No. 00098G
File history
Click on a date/time to view the file as it appeared at that time.
| Date/Time | Thumbnail | Dimensions | User | Comment | |
|---|---|---|---|---|---|
| current | 13:16, 4 November 2011 | | 989 × 1,200 (231 KB) | S8600021 (talk | contribs) | ==Bovine Morula and Blastocyst== The embryos were fixed and mounted on coverslips in such a way that the three-dimensional structure was maintained. DNA staining with DAPI is shown in white, f-actin filaments (phalloidin-TRITC) in orange. Scale bars repr |
You cannot overwrite this file.
File usage
The following page uses this file: