File:3D virtual muscle model 02.jpg
3D_virtual_muscle_model_02.jpg (600 × 529 pixels, file size: 112 KB, MIME type: image/jpeg)
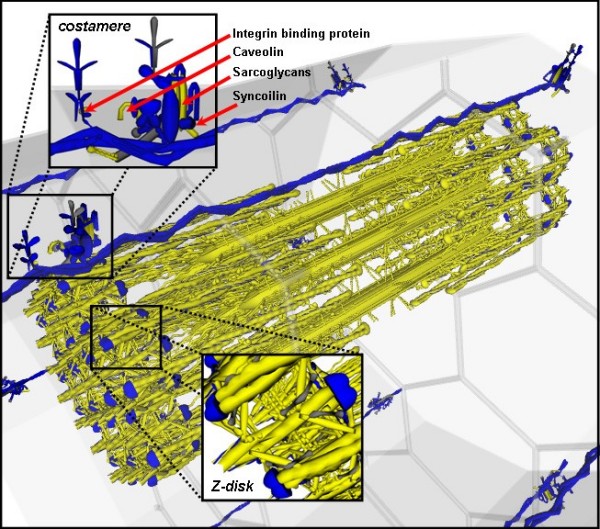
Spatial gene expression of muscle cell using the VMus3D (myoblast to myotube)
Using the 100,000 simulated cluster analysis data to visualise two clusters of gene expression as a function of terminal differentiation and tissue specificity.
- Blue is belonging to cluster 2
- Yellow is belonging to cluster 1.
Using the simulated 100,000 component analysis, the original gene expression data was adjusted to these clusters, and assigned to cluster 1 and 2 respectively.
Original file name: Figure 5. 1752-0509-2-88-5.jpg http://www.biomedcentral.com/1752-0509/2/88/figure/F5
BMC Systems Biology 2008 2:88 doi:10.1186/1752-0509-2-88
- "Myogenesis is an ordered process whereby mononucleated muscle precursor cells (myoblasts) fuse into multinucleated myotubes that eventually differentiate into myofibres, involving substantial changes in gene expression and the organisation of structural components of the cells. To gain further insight into the orchestration of these structural changes we have overlaid the spatial organisation of the protein components of a muscle cell with their gene expression changes during differentiation using a new 3D visualisation tool: the Virtual Muscle 3D (VMus3D)."
Reference
<pubmed>18945372</pubmed>| PMC2596796 | BMC Syst Biol.
© 2008 Waardenberg et al; licensee BioMed Central Ltd.
This is an Open Access article distributed under the terms of the Creative Commons Attribution License (http://creativecommons.org/licenses/by/2.0), which permits unrestricted use, distribution, and reproduction in any medium, provided the original work is properly cited.
File history
Click on a date/time to view the file as it appeared at that time.
| Date/Time | Thumbnail | Dimensions | User | Comment | |
|---|---|---|---|---|---|
| current | 07:36, 28 September 2010 | | 600 × 529 (112 KB) | S8600021 (talk | contribs) | ==Spatial gene expression of muscle cell using the VMus3D (myoblast to myotube)== Using the 100,000 simulated cluster analysis data to visualise two clusters of gene expression as a function of terminal differentiation and tissue specificity. * Blue is |
You cannot overwrite this file.
File usage
The following 2 pages use this file: